

Track Local COVID-19 Infections And Stats With New Interactive Map
April 16, 2020
By Mike Kruzman / news@whmi.com
The Livingston County Health Department has released a new interactive map to track COVID-19 infections in the county.
Residents can find the tracker by clicking on the COVID-19 banner towards the top of the county’s website, www.livgov.com, and then by clicking on the blue Interactive Dashboard and Map link located there. They will be taken to a webpage that shows a map of the county on one side, and important information on the other.
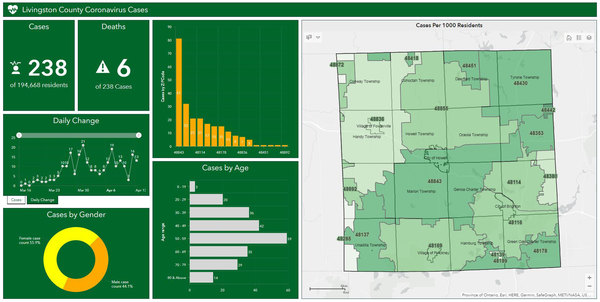
The tracker shows not only the number of cases and deaths in the county, but also a graph of total cases over time and daily cases confirmed, so the public can see for themselves a visual representation on how efforts to “flatten the curve” are playing out in real time. Statistics on gender and cases by age demographics are also represented. Residents can also track numbers by zip code, either on an available graph, or by clicking on the Livingston County map. As of Wednesday afternoon, 56% of those infected were women, with the 50 to 59 age bracket being the hardest hit. The 48843 zip code has been the hardest hit, accounting for roughly 34% of the county’s cases, with the 48816 coming in second with 13%.
View the dashboard and map here: https://livgov.maps.arcgis.com/apps/opsdashboard/index.html#/b6dddfbad2ac4125812e301e5694e291